

In Oki-Toki, CRM forms are not just data forms, they are a full-scale tool connecting calls, customers, and analytics. In each form, agents record crucial details: the subject of the call, interest in the product, deal status, call outcome, etc.
Over time, forms turn into a customer’s history—showing the entire journey from the first contact to issue resolution. This helps understand the context of calls, see customer needs, and plan next steps. To compile reporting from forms, Oki-Toki offers two reports: Form Journal and Form Statistics.
In this article, we’ll explore how to properly build CRM form reports, which filters and parameters to use, and how to derive useful insights from the data.
Why call centers need CRM reporting
CRM reports help not just in storing data but also in managing the sales and service process. They show where a call turned into a sale, which forms remain unfinished, and which sources bring the most valuable clients.
This provides an opportunity to timely reallocate resources, adjust scripts, and improve data quality. Well-tuned reports turn daily routine into a manageable process, where each decision is backed by facts.
In Oki-Toki, reports are formed based on your parameters—system collects data, groups it, and presents the dynamics in a convenient form.
What you can learn from Oki-Toki form journal
Form Journal is a detailed report showing information on each contact: call time, script, fields filled by the agent, and the result.
It details all the questions and answers filled by the agent, as well as a link to the form itself. The report shows not only completed forms but also those still in progress or in the queue. This is convenient when you need to control whether some contacts are stuck.
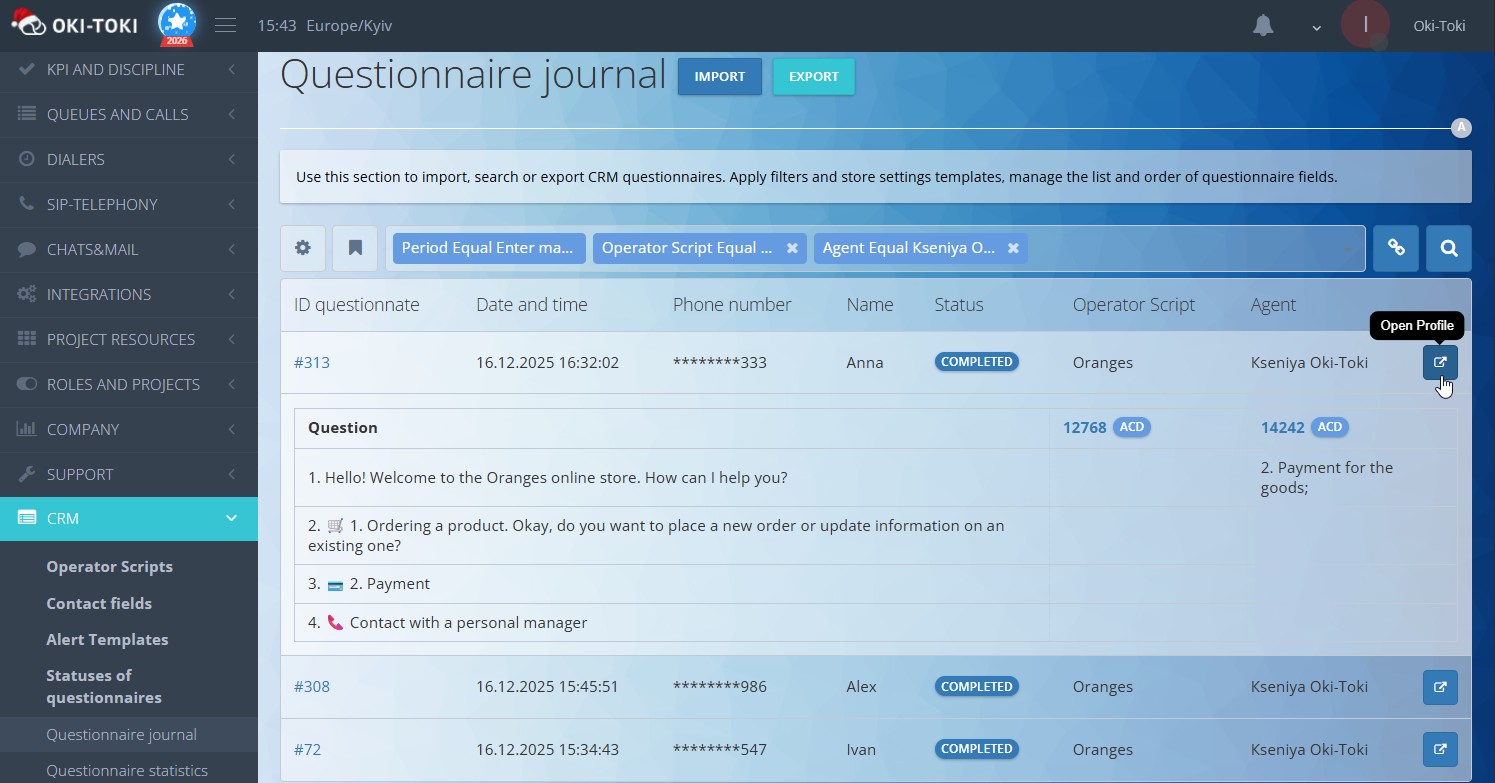
It’s easy to customize the list of displayed fields—keep only the necessary information and remove the rest.
How to build a report and extract data
Report building starts with selecting goals, then filters and parameters are chosen:
- Period — today, yesterday, week, month, or any manually specified interval;
- ID of the form, call, or contact — if you need to find something specific;
- Agent script;
- Specific questions and answers from the script;
- Agent, dialer, import number, and etc.
After selecting parameters — just press the “Search” button on the right, and the report will update.
To share the result with a colleague, copy the link next to the “Search” button. If you need to send the report to a staff or customer without access to Oki-Toki, use the “Export” button—data can be extracted in HTML, Excel, or Google Sheets formats.
If you need to extract a report with full data of form filling (questions – answers) – specify a particular dialogue script in the filter.
For obtaining this report via API, use endpoint: https://home.oki-toki.net/api/v1/reports/crm/questionnaires-log
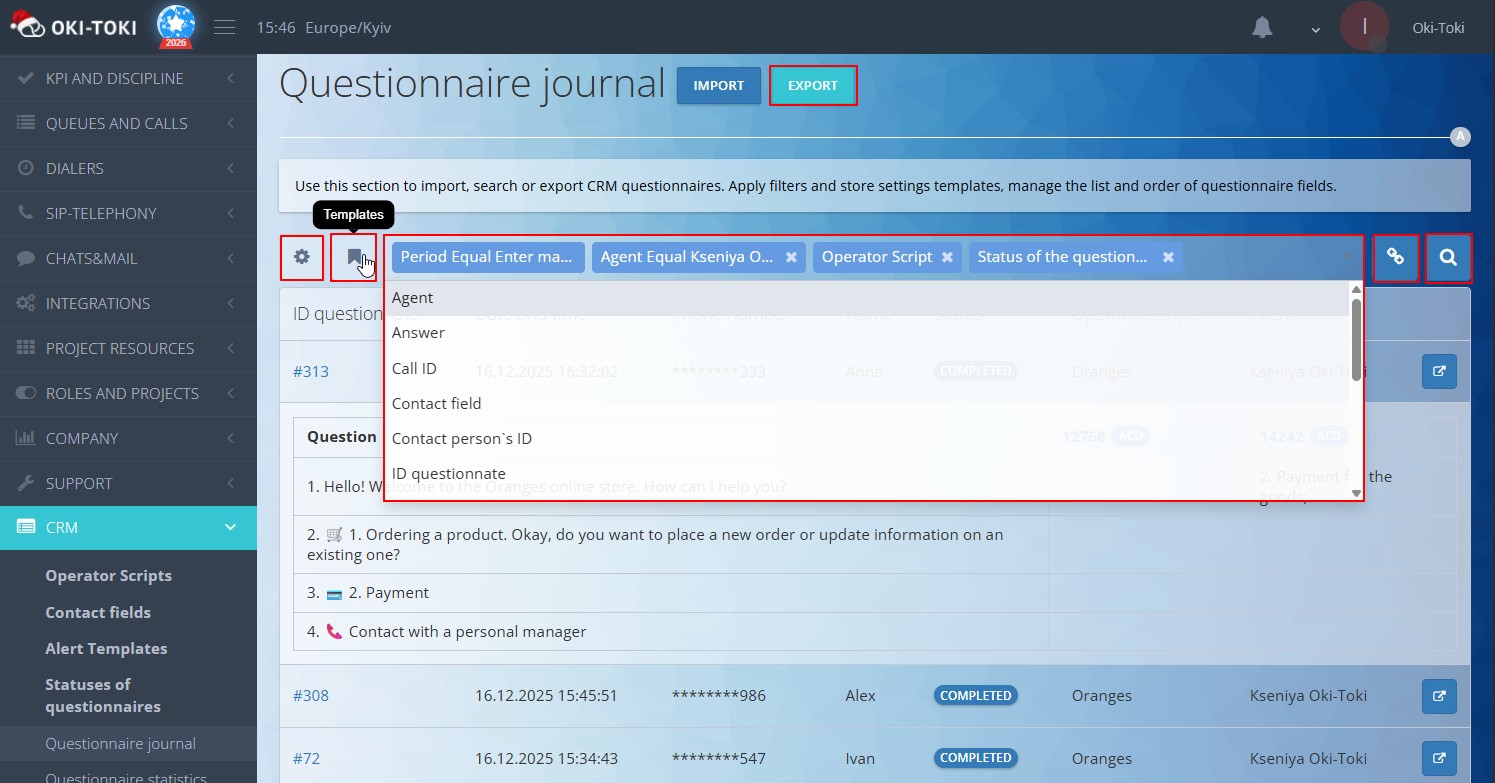
To avoid setting filters anew each time, you can use Templates. “General” – for all employees who have access to the report, and “Personal” – just for you. Select filters, for example, period – yesterday, form status – completed and add a template by pressing the button on the left, specifying its name.
Form statistics: a consolidated report on questions and answers
When agents work with scripts and fill forms in CRM, it’s necessary to understand the overall picture: how many forms are filled, what answers clients give, and how much each agent has processed. For this purpose, Oki-Toki offers the “Form Statistics” report.
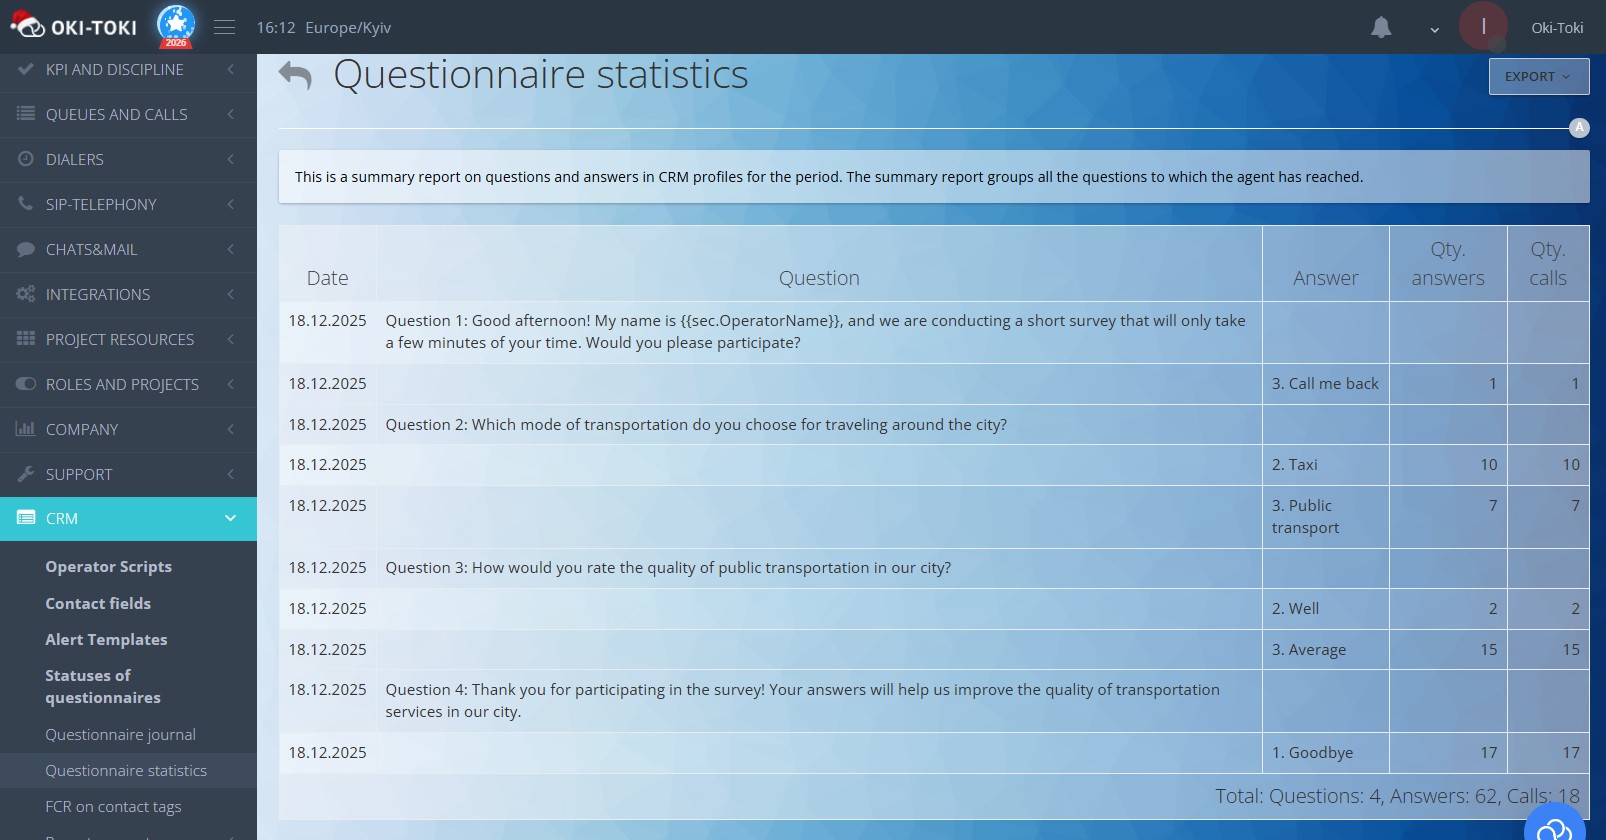
This is a consolidated report that gathers data on all questions and answers from the forms. You immediately see which question was asked, how many times it was answered, and how many calls are associated with it.
What you can learn from form statistics
The summary displays questions with the number of answers and calls. If you need details—they are also available: call ID, filling time, client’s phone, agent’s name, script name, and form status.
It’s convenient that you can directly access the Call Journal from the report to view a specific conversation or open the script that was used.
How to set up the report
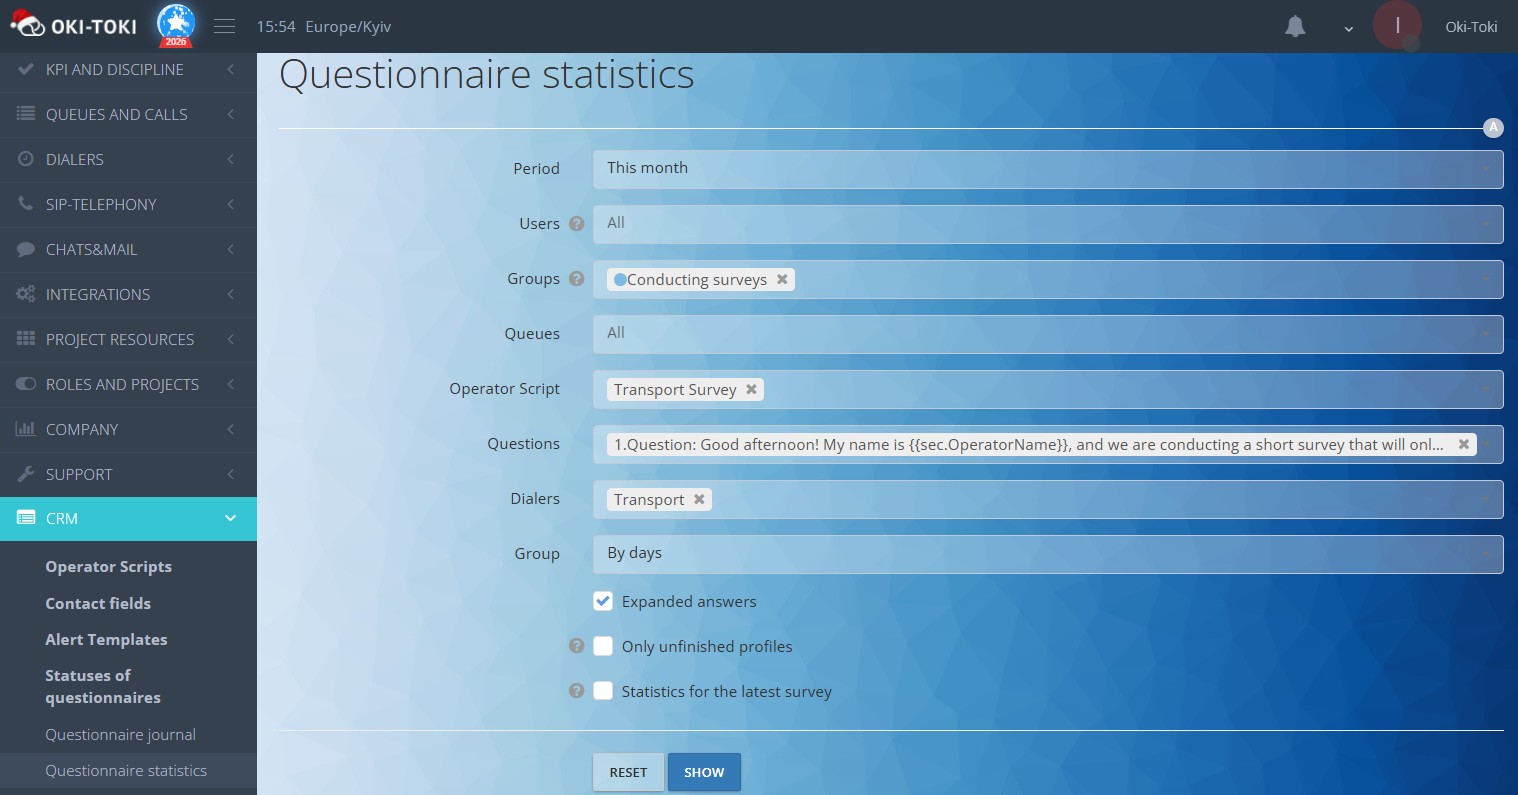
The report is flexibly configurable to your tasks. You can select the period, filter by specific agents, groups, or queues. If you need data by a particular script, dialer, or type of call—all these are available in the filters. It’s even possible to select specific questions from the form.
Data can be grouped in different ways: by users, by incoming authorization. You can display expanded answers or only unfinished forms. There’s an option to see statistics only by the last form—useful when a client was called several times, and the final outcome is important.
By clicking “Export”—data can be extracted in formats HTML, Excel, or Google Sheets. For obtaining this report via API, use endpoint: https://home.oki-toki.net/api/v1/reports/crm/process
To avoid manually building the report every day, set up automatic email sending through “Reports”. For instance, receive a summary every morning or once a week—as convenient. This saves time and helps stay informed without extra effort.
Which report to choose: form journal or form statistics
Both reports work with the same data, but solve different tasks.
Form journal suits when you need to:
- Find a specific form or call;
- See what exactly the agent filled;
- Check unfinished forms;
- Understand the details of an individual case.
Form statistics is useful if you want to:
- See the overall picture across all forms;
- Understand which answers are most frequent;
- Compare the performance of different agents;
- Track dynamics over periods.
In practice, these reports are often used together: Form Statistics for general numbers and identifying deviations, then Form Journal for digging into specific cases.
Practical tips on working with reports
- Start with the main question. Before building a report, determine what you want to find out. This will help select the right filters and not drown in unnecessary data.
- Save templates. If you regularly view the same indicators—save the settings as a template. This saves time and reduces the likelihood of error.
- Set up automatic reports. It’s better to receive key reports automatically. This way, you won’t forget to check the indicators and can quickly notice problems.
- Monitor unfinished forms. They often indicate problems: an agent didn’t complete the conversation, a client hung up, something went wrong. Regular checks help respond in time.
- Compare periods. A single data snapshot is not very informative. Comparing with last week or month will show trends and help understand whether things are improving or worsening.
Form Journal and Form Statistics are two reports that complement each other. Form Journal offers a detailed view on each contact, while Form Statistics provides an overview across all forms. Together, they help not just collect data but turn it into understandable analytics.
Well-configured reports save time, help identify problems before they become critical, and provide a basis for decision-making.