Why is it important to understand reports?
Reporting in a contact center is not just about boring tables. It’s the foundation for decision-making. Incorrect reports are like a broken compass for a ship captain: they lead to wrong conclusions and erroneous actions. In this article, we will talk about 10 common mistakes in contact center reporting that can mislead you, and share simple ways to avoid them.
1. Lack of clear order in data
When information is stored without a system, you risk getting confusion in reports. For example, data can be duplicated or, on the contrary, not taken into account. To avoid this, set clear rules for data collection and storage. Use unified formats and make sure everyone knows how to correctly fill out reports.
- In Oki-Toki, there are more than 36 different types of reports, including detailed call logs and agent statuses, summary reports that can be downloaded in any format. With the report builder, you can combine data from different sections. By using report templates, employees will be able to work according to uniform standards.
2. Errors in data interpretation
It’s important not just to collect numbers but to understand them correctly. Often, it seems that if one indicator is high, then everything is okay, but in reality, this may hide other problems.
- Always analyze data in the context of the whole picture — how other metrics are performing, whether they contradict each other. For example, one agent spent 30 minutes in a conversation, while another — 60. At first glance, it may seem that the one who spent more time on the line solved more issues. But after analyzing the calls, it turned out that the agent who talked less closed more deals in that time. And the agent with longer conversation duration encountered a complicated situation, recurring questions, and closed fewer leads. Therefore, for a comprehensive analysis, it is necessary to compare not only the dialogue time but also metrics such as the number of issues resolved, the percentage of closed deals, etc.
3. The misconception of “all-knowing” KPIs
Relying solely on KPIs can make you miss important details. For example, a high percentage of processed calls doesn’t always mean that customers are satisfied. Perhaps, agents are forced to rush and don’t spend enough time with customers. Contact center data analysis should take a comprehensive approach: besides KPIs, look at customer feedback, wait time, and other indicators.
International indicators, such as Service Level (SL), First Call Resolution (FCR), and Average Handling Time (AHT), provide a more accurate assessment of a contact center’s efficiency.
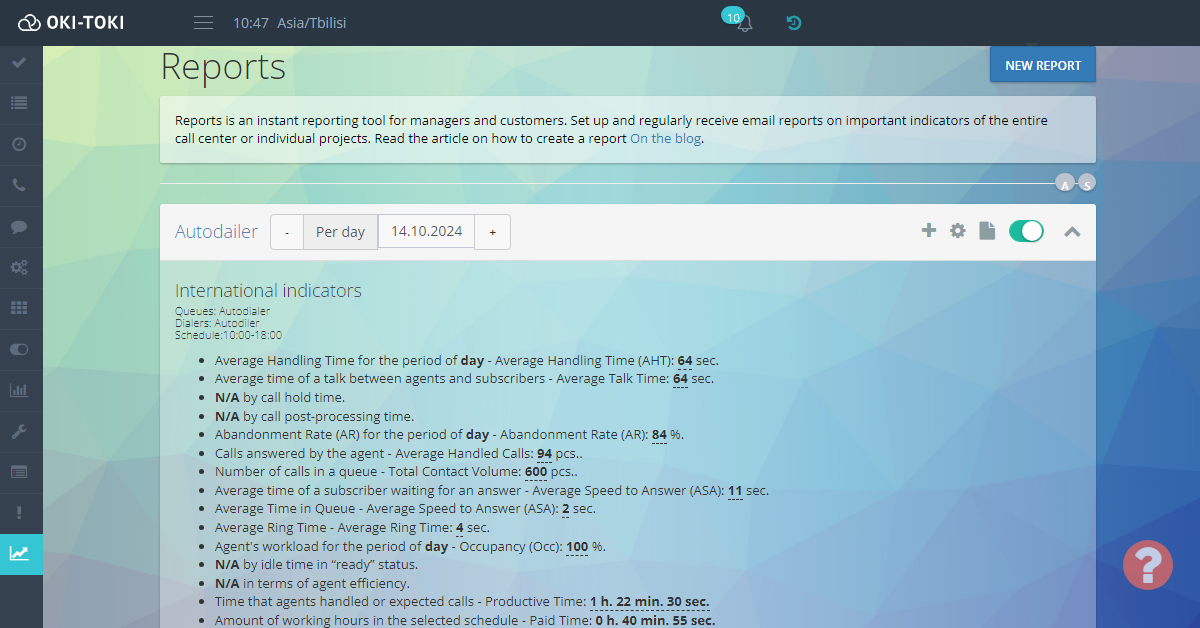
- By using the key performance reports – Reports, you get only the necessary data about the contact center’s operation with your custom metrics. Reports are generated for different periods – day, week, month, or year. Meanwhile, the history of indicator changes is preserved. Thanks to such a report, you can easily identify main trends and adjust the work of employees.
4. Mistake in prioritizing AHT: time versus quality
When an agent tries to fit into a certain time (AHT) and ends the conversation without resolving the issue, the customer is often forced to call back. As a result, despite adhering to time norms, the efficiency of work decreases due to repeat contacts.Ideally, if an agent solves the customer’s request on the first call — this is called First Call Resolution (FCR). The FCR indicator is important because it reduces the number of repeat contacts, increases customer loyalty, and reduces the line’s load. Of course, resolving issues may take a bit more time, but it saves the agents’ resources in the long term, as it increases the overall percentage of successfully closed inquiries without additional calls.
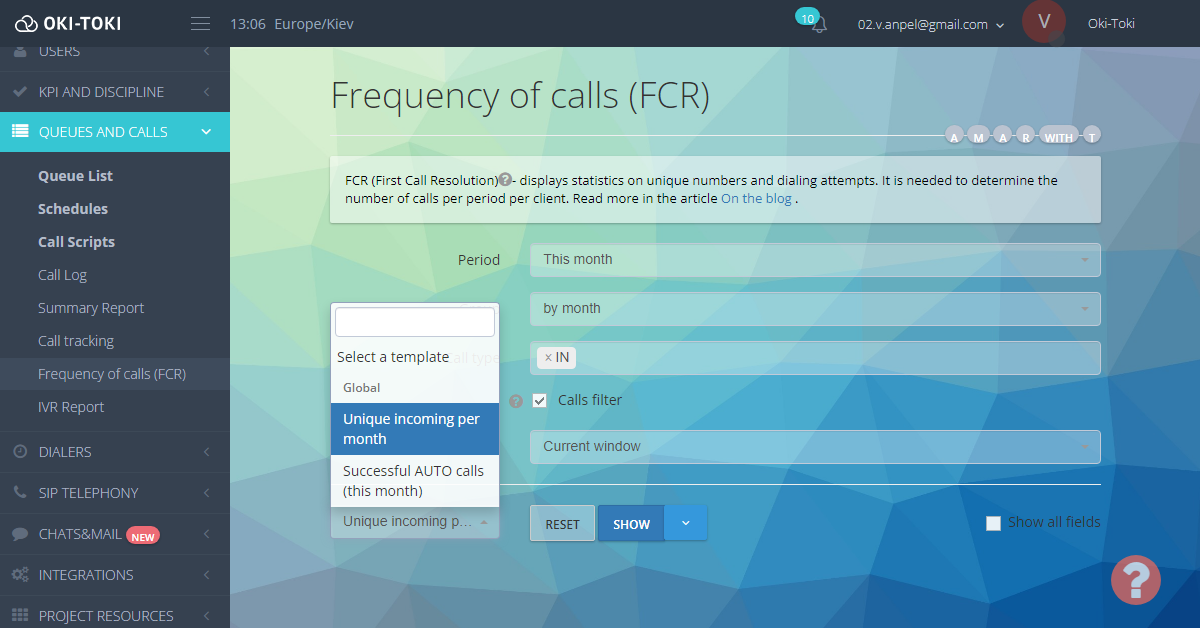
- The report on the First Call Resolution (FCR) indicator in Oki-Toki will show how successfully customer issues are resolved on the first call. Read more in a separate article on the blog.
5. Irrational allocation of tasks
When the workload is distributed unevenly, some agents are overloaded, while others sit idle. This not only reduces productivity but can also lead to stress and dissatisfaction. Ensure that tasks are distributed evenly and adjust plans based on the current situation.
- In Oki-Toki, use not only reports but also simple widgets to track the load on agents by metrics Occupancy. This way, you can see in real-time who is overloaded and who is free, and quickly adjust tasks. This approach will balance the team’s work.
6. Don’t forget to analyze the history of previous values
Accumulated data for the past period, such as waiting time, average call duration, or the number of missed calls, can tell a lot about your contact center’s work. Here are a few simple approaches:
- Comparing data for different periods: Analyze reports for a day, week, or month to see trends. For example, if the workload on Fridays increases, you can plan to increase the number of agents in advance.
- Using automatic reports: In Oki-Toki, you can set up reports that will show important indicators — waiting time, the number of resolved inquiries, etc. This will make your work easier and allow you to quickly see where improvements are needed.
- Adjusting schedules based on data: To better manage agent shifts, use data on workload. If reports show that calls are more frequent during certain hours, increase the number of agents for these shifts. Also, consider each agent — if someone works faster, give them more complex tasks. This approach will help maintain balance, avoid overloading employees, and reduce the number of missed calls.
7. Lack of clarity
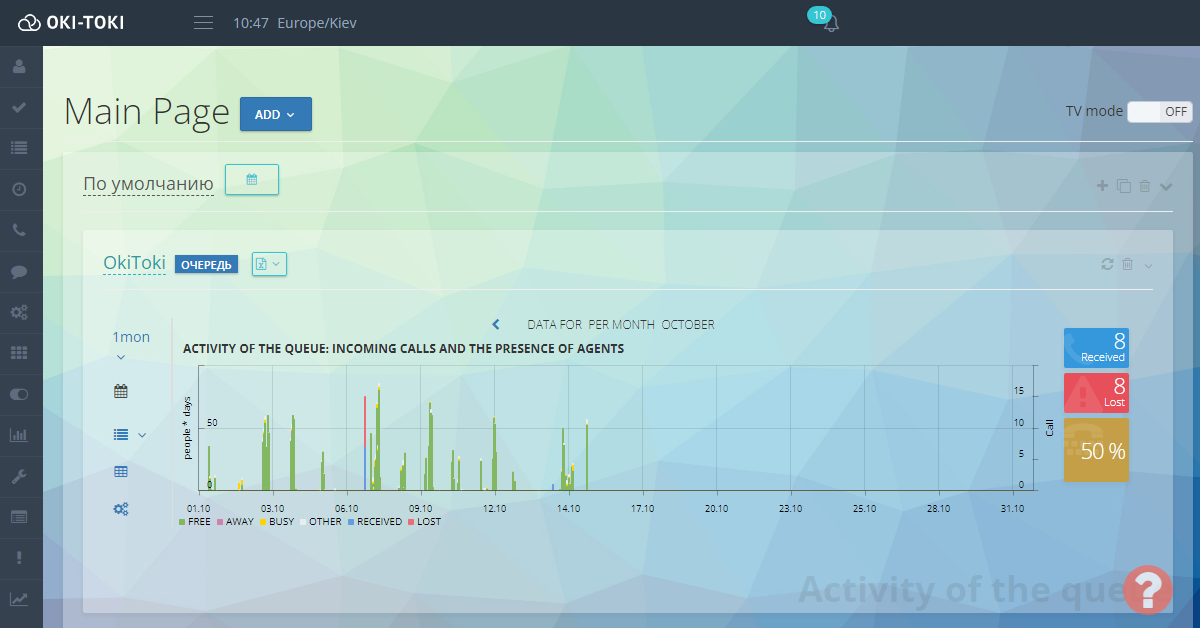
Don’t overload reports with dry numbers — it’s much easier to understand information if it’s visualized. Charts, graphs, and other visual elements will help you and your team to analyze data faster and make decisions promptly.
- In Oki-Toki there are graphs and charts, so key metrics are always at hand and displayed in a convenient and understandable form. This will allow you to not waste time on deciphering numbers, but focus on making decisions.
8. Hidden errors in call statistics
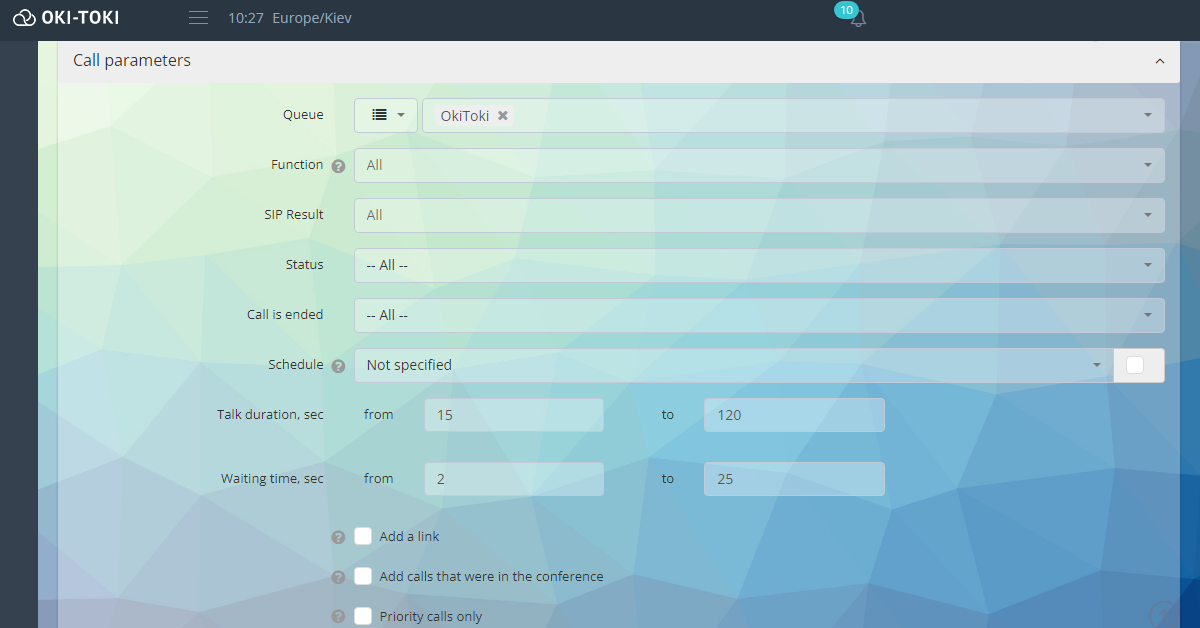
Contact center supervisors often misinterpret incoming call statistics. Erroneous dials or short calls can create the illusion that the customer refusal rate is higher than it actually is. It’s important to consider such moments and use a call duration threshold — for example, five seconds, — to exclude accidental calls. This approach will help you more accurately assess the real picture of interaction with customers and avoid errors in the analysis.
- In Oki-Toki reports, you can set a minimum call duration time to exclude accidental or erroneous calls. This helps focus only on those calls that are truly important for analysis. Configure the reports so that they display real data on accepted calls. This will give you a full understanding of the load on agents and help you correctly distribute tasks among them.
9. Don’t ignore data from your company’s website
Website visitors are potential customers, and it is important to consider interaction with them.
- In Oki-Toki, you can integrate WebCall and GetCall so that users can contact you directly from the website. All calls will be accounted for in the reports. For example, the Call tracking report displays statistics of unique incoming numbers, dialing attempts, wait and conversation duration for each client. This will help you work effectively with leads.
10. Insufficient quality control
Quality control reports are not just numbers, but a way to understand how well your contact center is functioning. They vividly show how agents communicate with customers and how quickly problems are resolved, as well as weak points in employees’ work
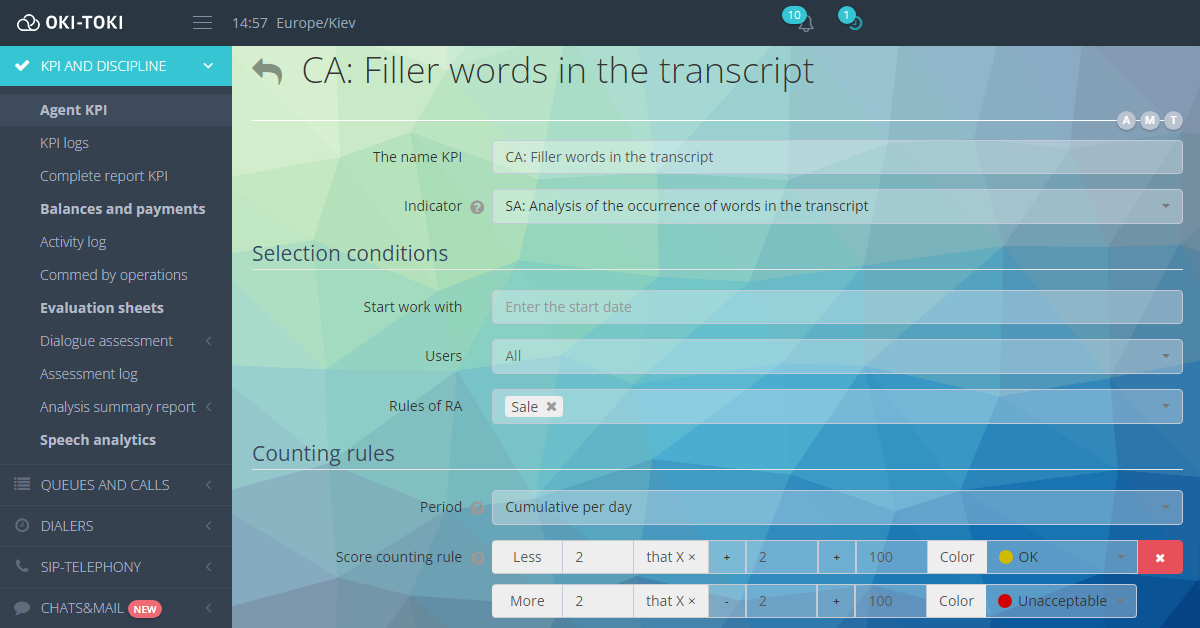
- In Oki-Toki, there is a KPI section with dialogue assessment, audit plans, assessment sheets, KPI journal, and summary reports. Assessment sheets will help determine how politely and quickly your employees respond to calls, adhere to scripts, and resolve customer requests. With a flexible filter in reports, you can quickly find the needed conversations and compile accurate audit plans.
Mistakes in reporting can be costly, but they can be avoided if you know what to pay attention to and use the right tools. At Oki-Toki, we offer everything you need for report automation and analysis — from ready-made templates to detailed metrics.
Whether you’re a new user or already working with Oki-Toki, our tools are designed to be easily learned and used. The system is intuitive and adapts to your needs, ensuring maximum comfort at work.
Our support service is always available to help you understand report settings and make them useful for your business. Want to learn more? Just leave a request, and we’ll contact you to discuss the details and help you take your contact center to a new level.