
A call center can look busy and successful. Lots of calls, agents at work, reports filled out. But high workload doesn’t yet mean the project is making money. To understand where money is being lost, unit economics are calculated. In this article, we’ll break down what it is, how to choose a unit, and how to calculate its cost with simple examples.
What are a unit and unit economics
A unit is the measure by which a project’s economics are calculated. In a contact center, it’s one interaction, for example a call. And unit economics shows how much such a unit costs and what it brings: profit or loss.
Why per single unit and not the entire budget? The monthly budget only shows the overall result. A project can be in the black even if some interactions are unprofitable, as they’re covered by profitable ones. But calculation per unit shows what’s happening inside. If the unit is profitable, growth brings money. If it’s at a loss, it takes money away.
What to take as a unit
A unit can be chosen differently, and all subsequent formulas depend on this. The main options are:
- contact (interaction): basic and most common unit: one interaction with a customer in any channel (call, chat);
- resolved interaction: the same, but accounting for the fact that one issue may require 2-3 contacts (first touch ➝ callback ➝ resolution);
- lead or deal: when the result matters, not the conversation itself, typical for sales;
- agent: when you need to calculate the economics of one workstation;
- customer: if calculating in relation to LTV.
What to choose depends on what the call center gets paid for: processing interactions or results. Service is counted by interactions, sales — by leads and deals. The numbers for calculation should be based on real data from reports of the system the call center uses.
What makes up the cost
A common mistake is to only count agent salaries. In reality, the cost includes more categories:
- Agents: salaries, bonuses, taxes on top of salaries. Usually 60–70% of all call center expenses;
- Management: supervisors, team leads, trainers. Their salaries are also included in the cost of an interaction;
- Turnover: expenses for hiring and training each newcomer, plus their low output at the start. In call centers, 60–80% of people leave within a year;
- Technology: licenses, telephony, call minutes, CRM, bots, analytics;
- Overhead (call center maintenance): office rent or remote setup, internet, accounting, administration.
These five expense categories together give the real cost. Add them up and divide by the chosen unit. That’s the price of one contact. Next, we’ll illustrate this with numbers.
Example 1. Service call center: cost per contact
Let’s agree on the numbers right away. They’re not taken from a specific project and aren’t universal. This is a conditional example based on market indicators for Eastern Europe (Ukraine and neighboring countries) to illustrate the calculation principle itself.
If you work in another country, the final amounts will most likely differ: for example, in Western Europe the cost of one incoming interaction can be several times higher. But the logic remains the same: substitute your expenses and interaction volume, and you’ll get the cost per contact specifically for your center.
Calculating cost per contact
Let’s take a small support call center. The inputs are:
- 10 agents × €600/month (with taxes);
- supervisor €1,200/month;
- technology €1,000/month;
- overhead €800/month;
- 20,000 interactions per month (real number from reports).
All expenses together = €9,000 per month. Now we need to calculate the cost of one contact. Divide total expenses by the number of interactions: 9,000 / 20,000 = €0.45. This is Cost per Contact. A basic number that most call centers don’t know about themselves.
Why cost per contact is needed
The client pays a fixed price for each processed contact, let’s say €0.60. The cost of processing one contact in the call center is €0.45, which means €0.15 profit remains from each interaction. If the cost were reduced by just a couple of euro cents, profit would grow, without hiring anyone.
But not all contacts are equal
Cost per contact is the basis of calculation. Without it, the economics aren’t visible. But it counts all calls together, and some of them are repeat calls: the issue wasn’t resolved the first time, the person calls again, and the call center incurs costs for it.
This proportion is shown by FCR: how many issues are closed from the first interaction. Let’s say FCR = 75%: out of 4 questions, 3 are resolved immediately, one goes to repeat. Then, out of 20,000 contacts, there will be 15,000 actually resolved issues, with the remaining 5,000 being repeats. But expenses are the same — all €9,000. Divide expenses not by the number of interactions, but by resolved issues: 9,000 / 15,000 = €0.60 per resolution.
One resolution costs not €0.45, but €0.60. The €0.15 difference is the price for repeats. Therefore, alongside cost per contact, they look at cost per resolved issue (Cost per Resolution).
All these calculations are not in vain. Cost per contact shows how much processing an interaction costs, and cost per resolution — how much of that is attributed to repeat calls.
Support with upsells
The same center’s economics can be calculated from another angle. If an agent resolves a customer’s issue and additionally sells a related service, the call center gets another income source: upselling.
Let’s say out of 20,000 interactions per month, 600 end with an upsell. For each such sale, the client pays the call center an additional €5.
Additional income: 600 × €5 = €3,000 per month.
This €3,000 covers part of the project’s expenses. Therefore, the cost per contact decreases: it was €0.45, it became €0.30. The same agents and interaction volume lead to better project economics.
Conclusion from the case: the same call center work is evaluated differently depending on what you count:
- per contact: €0.45;
- per resolution: €0.60;
- with upsells: €0.30.
The numbers don’t contradict each other; rather, they complement each other. Together, they show where the call center is losing and where it can earn.
Example 2. Sales call center: profit per shift
In sales, the client pays the call center not for a processed contact, but for a closed sale. Therefore, the unit here is different: not a contact, but an agent’s shift (workday). The inputs are:
- an agent costs the call center €30 per day (the same €600/month as in the first example, divided by ~20 working days);
- per shift they make 100 productive calls;
- 5% conversion, meaning 5 sales out of 100 calls;
- for each sale, the client pays the call center €6.
Let’s calculate: 5 sales × €6 = €30 income, and the agent costs €30. Income exactly equals expenses. The agent worked the shift and earned zero.
Why calculate per shift
Income consists of three factors: number of calls, conversion percentage, and sale price. By the end of the shift, it’s immediately clear whether the agent brought profit or loss.
What moves the shift into profit or loss
Conversion up. If the agent closes not 5, but 6 sales out of 100, conversion is already 6%. Income: 6 × €6 = €36. Minus €30 expenses, and the shift is in the black (+€6 per day).
Conversion down. On a bad day, the same agent closes 4 out of 100. Here, conversion is 4%. Income: 4 × €6 = €24. Minus €30, and the shift is in the red (−€6 per day). Nobody was fired; the calls just went worse.
Higher-priced sale. Sales are again 5, but the expensive plan sells more often, and the average payout grows from €6 to €8. Income: 5 × €8 = €40. This results in +€10 per shift, due to deal quality, not quantity.
Conclusion from the case: the same shift can come out at zero, in the black, or in the red. It all depends on how the calls go. In a sales call center, there’s no point in counting only contacts: the result matters, and it’s better seen at the shift level. We’ll analyze how to bring a shift into the black below.
Ways to increase profit without hiring
In all examples, the weak point isn’t a shortage of people, but how they work: downtime, repeat calls, routine that doesn’t need to be done manually. Here are ways to increase profit with the same resources:
- Reduce agent downtime. Between conversations, time is spent on dialing numbers, no-answers, breaks, and after-call work. A dialer takes care of the biggest part. It dials and filters out invalid contacts itself, so significantly more conversations happen per shift, and with them more profit. Breaks, after-call work, and database quality are improved separately: with scheduling, scripts, and contact cleaning.
- Increase FCR. Need to give the agent everything to resolve from the first time: interaction history, ready answers, and the authority to close the issue without transfer to another department. Fewer repeat calls means less work that the call center pays for but doesn’t get paid for.
- Increase conversion. In sales, shift profit is decided precisely by conversion: even a small increase takes the agent from zero to the black, without a single new employee. It can be grown with prompts, scripts, and call reviews: you can see where the agent loses the customer, what worked for strong performers, and what to teach the rest.
- Increase average check. The same sales per shift bring more if the expensive plan sells more often or a related service is added to the sale. Income grows with the same workload. Here conversation scripts help, which prompt the agent when and what to offer.
- Add upsells (where appropriate). Where service touches a product that can be expanded, the agent also offers additional purchases. This doesn’t work everywhere. In tech support or government services, it’s unnecessary. This is additional income that covers part of the center’s expenses, and support starts partially paying for itself.
- Automate the simple. Transfer typical questions («where’s my order», «what’s my balance») to IVR or a bot so they’re not taken by a live agent. This removes a noticeable share of interactions from agents, and with it the cost of processing. Important: only assign simple tasks to the bot; otherwise, the customer will break through to an agent anyway, and both contacts will incur costs.
- Give agents scripts and prompts. Prompts on screen: what to answer, what to offer, how to handle objections. This reduces talk time (AHT), increases conversion in sales and FCR in support without loss of quality.
All these methods have a limit: service quality. Savings make sense as long as the customer remains satisfied. If the service level drops in pursuit of numbers, some customers leave, and losses outweigh all savings. Therefore, any changes should be tracked together with customer loyalty.
Where to get the numbers? Oki-Toki reports
If the call center already works with Oki-Toki, finding metrics comes down to reviewing a few reports.
- Calls summary report displays the total number of interactions for the needed period. It can be taken both for the call center as a whole and broken down by: call type, queue, dialer, agent, or group. Such detail allows calculating the unit not only for the entire center, but also specifically (for a particular project or team).
- FCR report — the share of interactions closed on the first try, and repeat interactions.The
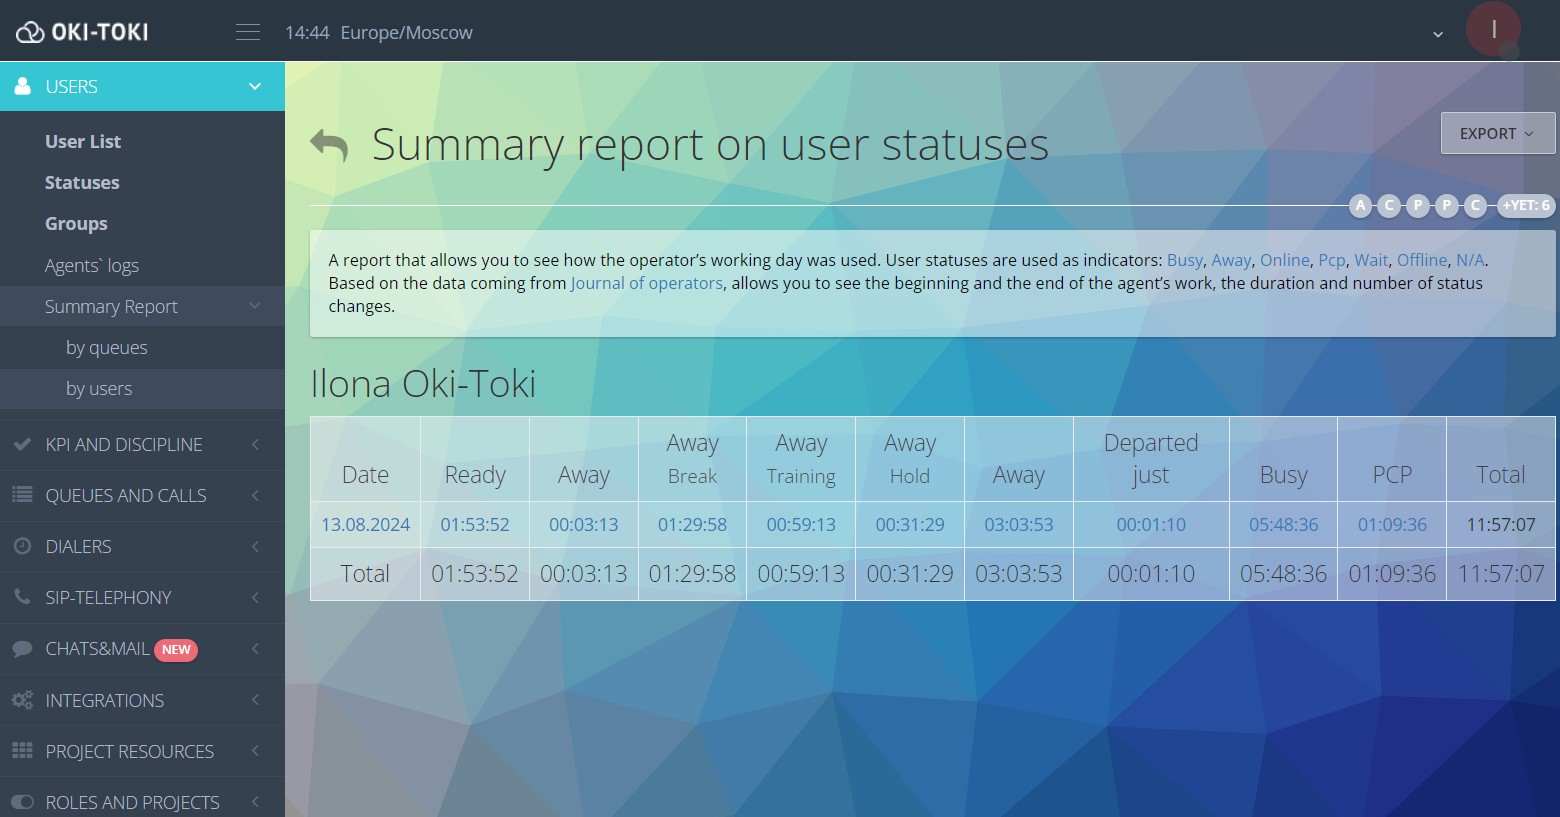
- User status summary report shows how much time the agent actually spent in the agent seat. The report can provide metrics on the duration of the agent’s time in different statuses.
- Sales conversion is calculated in two ways:
- by the Forms log, if the sale is recorded by an answer in the agent’s script. If there are multiple scripts, reports can be viewed for each separately and results added up.
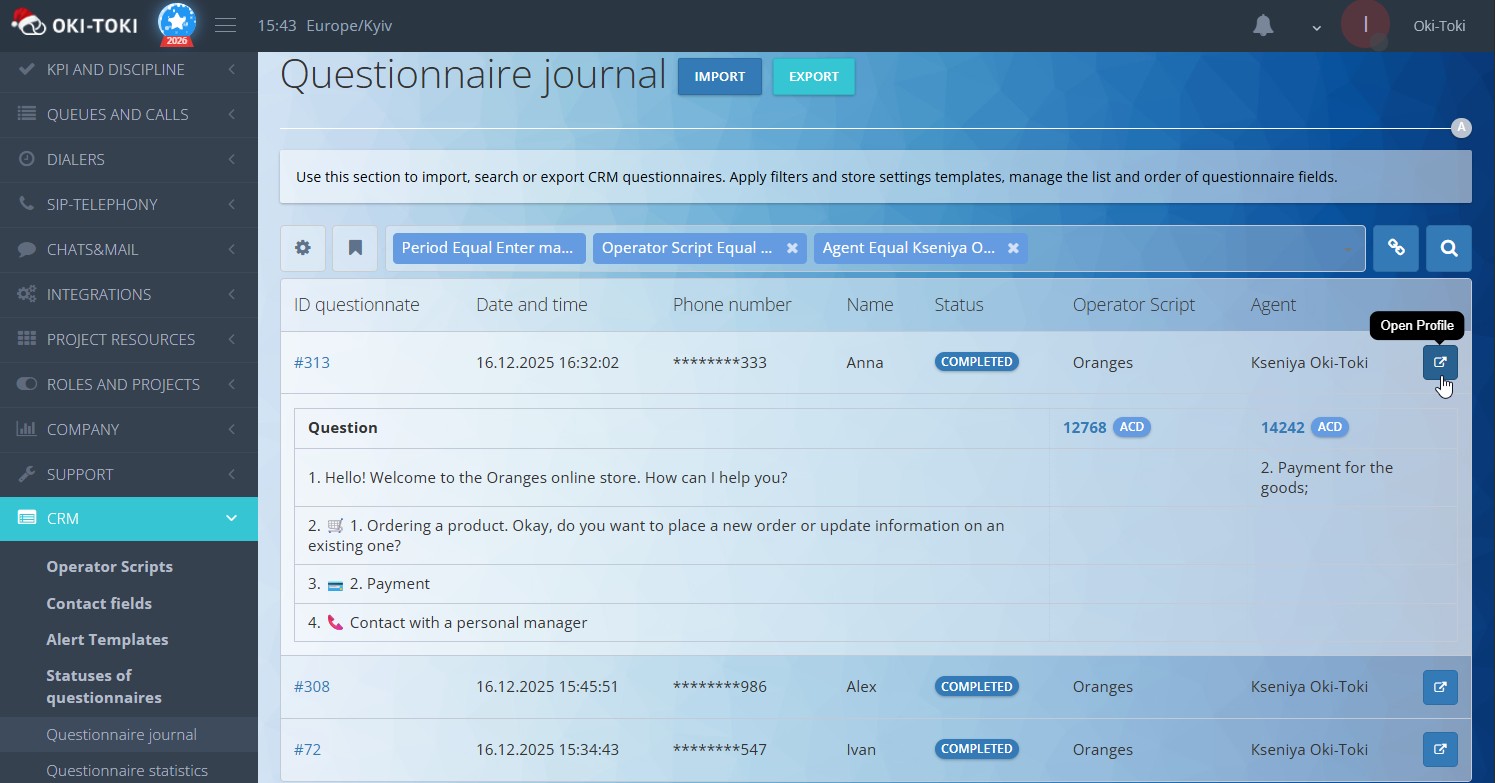
Then, conversion is calculated manually: divide the number of sales by the number of productive calls and multiply by 100. For example, 50 sales per 1,000 calls — that’s 50 / 1,000 × 100 = 5%.
- Financial report — expenses for the platform.
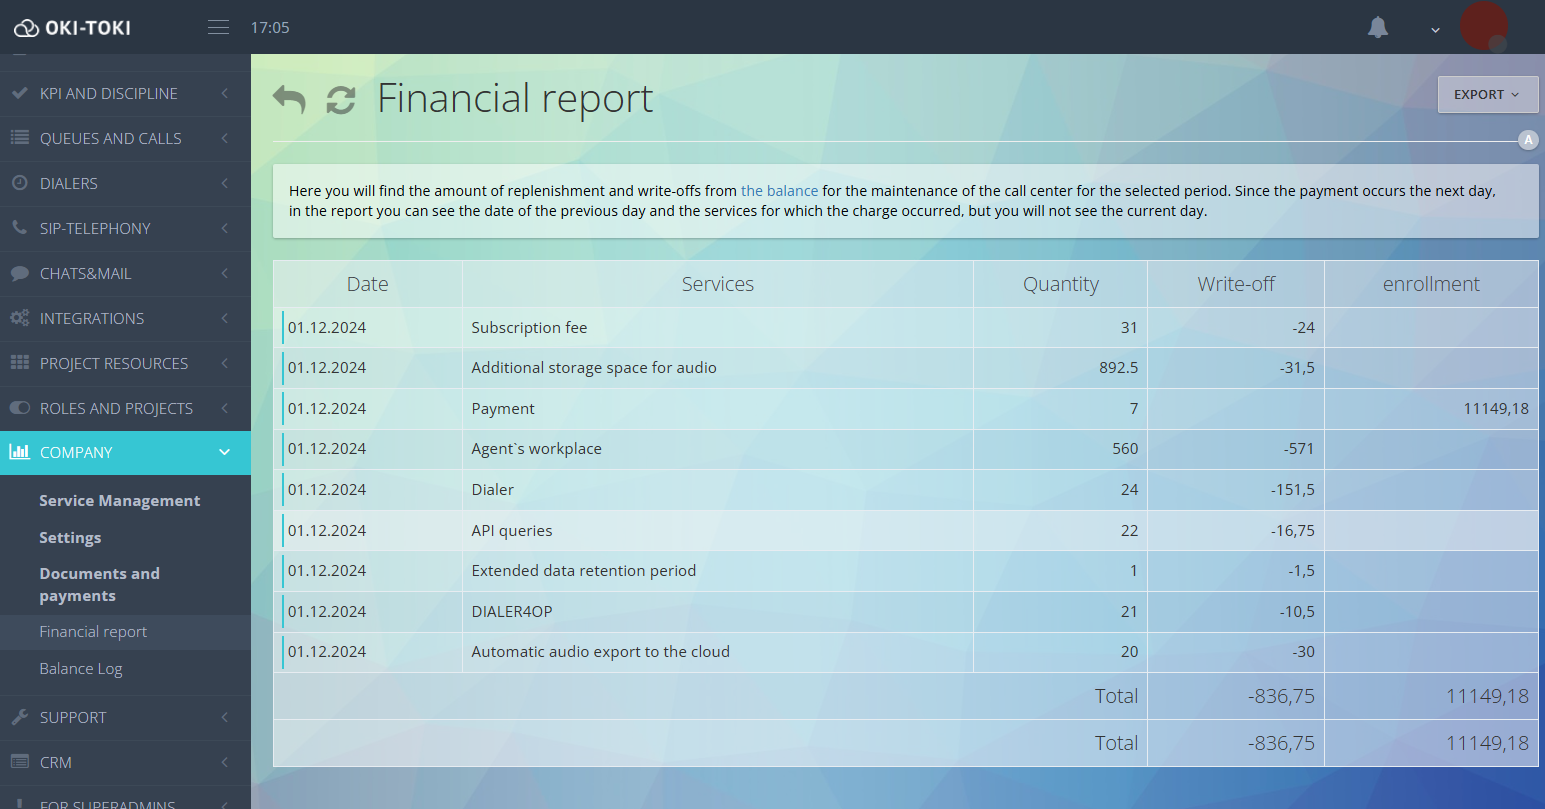
Oki-Toki provides metrics for calculation: interactions, FCR, working time, conversion, and other indicators. And the call center’s finance department knows the expenses (salaries, rent, telephony, taxes, and admin costs). Then, it’s simple: collect the indicators and calculate the cost of the unit.
Unit economics shows the real cost of contact center work: contact, resolution, or agent shift. Start with one project: calculate the unit cost and check where profit is being lost. Oki-Toki tools will then help optimize the necessary processes.
Read more about outsourcing center operations in the selection below:
- Software features for an outsourcing call center
- Why an outsourced call center isn’t growing (and what to do about it)
- Flexible schedule or fixed shifts: what’s more profitable for outsourcing?
- Outsourcing: Why clients leave contractors