Good business analytics in a call center not only helps to see how the team works, but also to find ways to make their work more efficient. In our article, we have described several types of analytics and how the Oki-Toki functionality is useful for data gathering. Call center analysis helps to identify weak spots, track important metrics, and improve operations to serve customers faster and more efficiently.
- Predictive Analytics
- Visual Analytics
- Customer Analytics
- Descriptive Analytics
- Diagnostic Analytics
- Speech Analytics
- Operational Analytics
- Analytics in a call center with Oki-Toki
Main types of analytics
Depending on the specifics of your organization and business cases, you can choose different approaches to analysis. Below, we describe what each type of analytics represents.
Predictive Analytics
Predictive, also known as forecasting analytics, takes data from past periods to determine how the situation will look moving forward. This approach prepares your call center for a sudden increase in calls or, conversely, a drop in activity. Use cases for analytics in the call center:
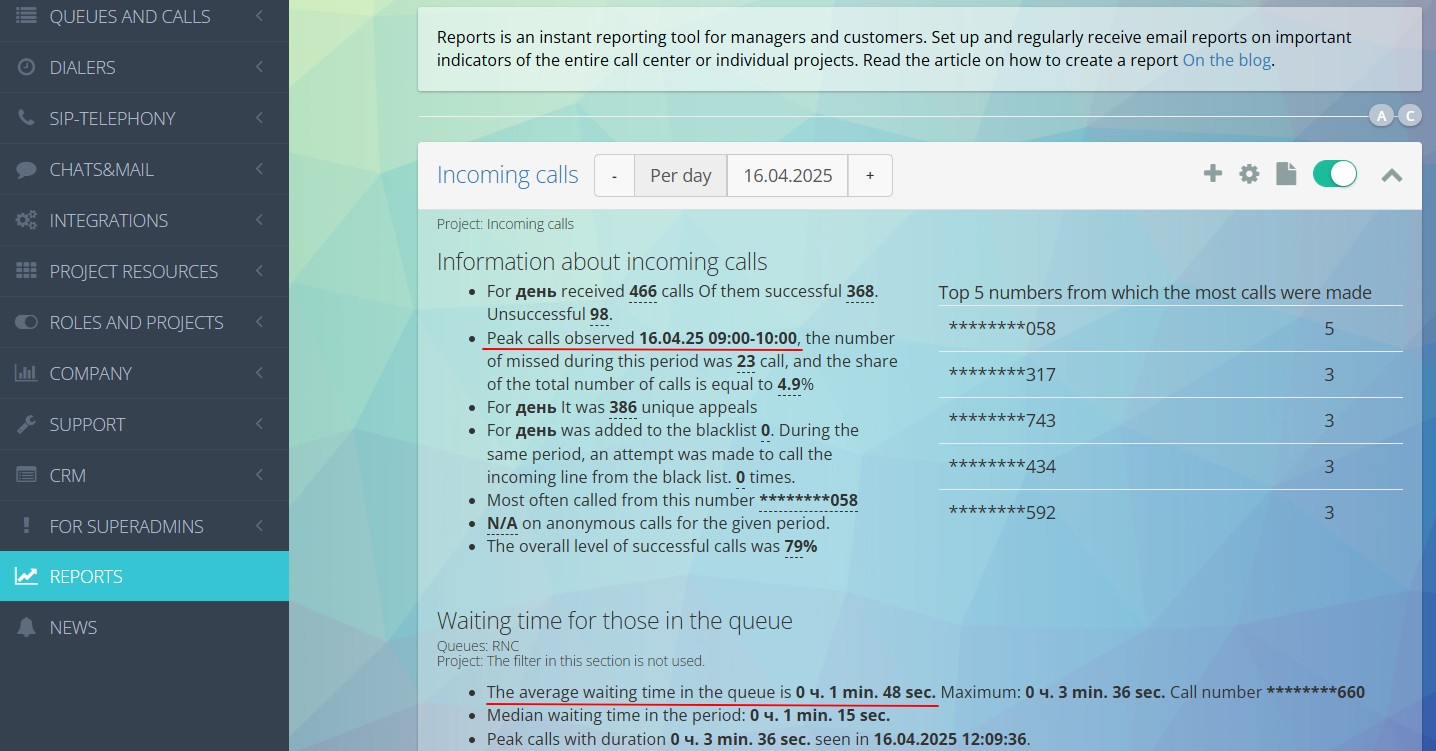
- According to the Oki-Toki report «Incoming Calls Details», you can see in which period there was a «peak» of calls and previous values to forecast when there will be a surge of clients again and adjust the work schedule in advance.
- In the same report, average waiting time (AWT) is displayed — this is how long customers on average wait for a free agent. If it’s longer than 60 seconds, there’s a chance that customers are not very satisfied with the service, and it’s worth adding agents to the incoming line.
- A dialer with configured redial rules will help schedule tasks for more appropriate times. For example, if incoming calls increase at certain hours – you can set another working time for the dialer in advance to balance the load.
By using call center predictive analytics, you can proactively manage resources, optimize workflows, and ensure that your call center is always prepared for fluctuations in client demand.
Visual Analytics
Visual analytics in Oki-Toki are charts, diagrams, and widgets that help quickly assess the situation without analyzing reports.
Some managers display charts and widgets about the call center operation on a separate monitor so that employees can see how things are in real time. Several examples:
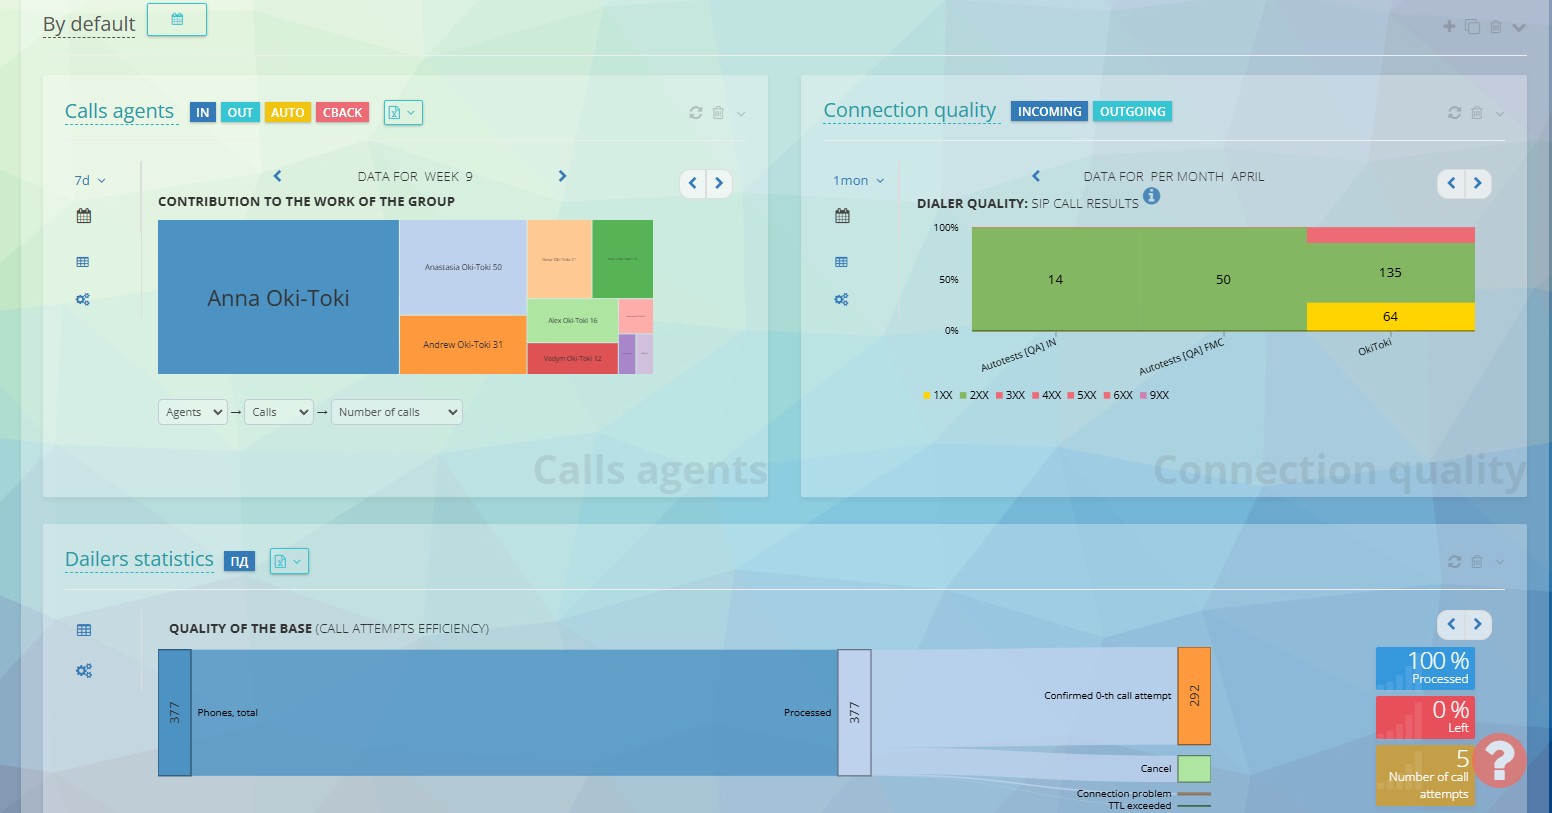
- The «Agent Calls» widget shows who takes calls more often and what percentage of calls are successful. There’s a filter for queues, users, and types of calls: incoming, outgoing, and dialer.
- The «Connection Quality» widget shows the percent of calls reaching clients and SIP call results, and «Dialer Status and Statistics» helps analyze the dialer’s operation.
Customer Analytics
Customer needs are the foundation of a contact center’s success. Without understanding preferences and sentiments, it’s difficult to provide a service that maintains a high “Customer Satisfaction Score” (CSAT). Customer analytics is aimed at analyzing customer behavior, their wishes, and interactions with the call center.
- You can set up a feedback system where customers can rate an agent on a scale from 1 to 5 or leave a voice message about the quality of service. This will help with customer data analysis and show where the interaction with company employees did not yield the expected result.
- Also, customers can be categorized based on, for example, the type of request or status (new, returning, VIP). This customer segmentation allows for personalized communication and distributing clients to specific agents.
- The FCR report determines how efficiently customer requests are resolved on the first call. If a client comes with the same problem several times, this could be a signal to make adjustments to the communication script.
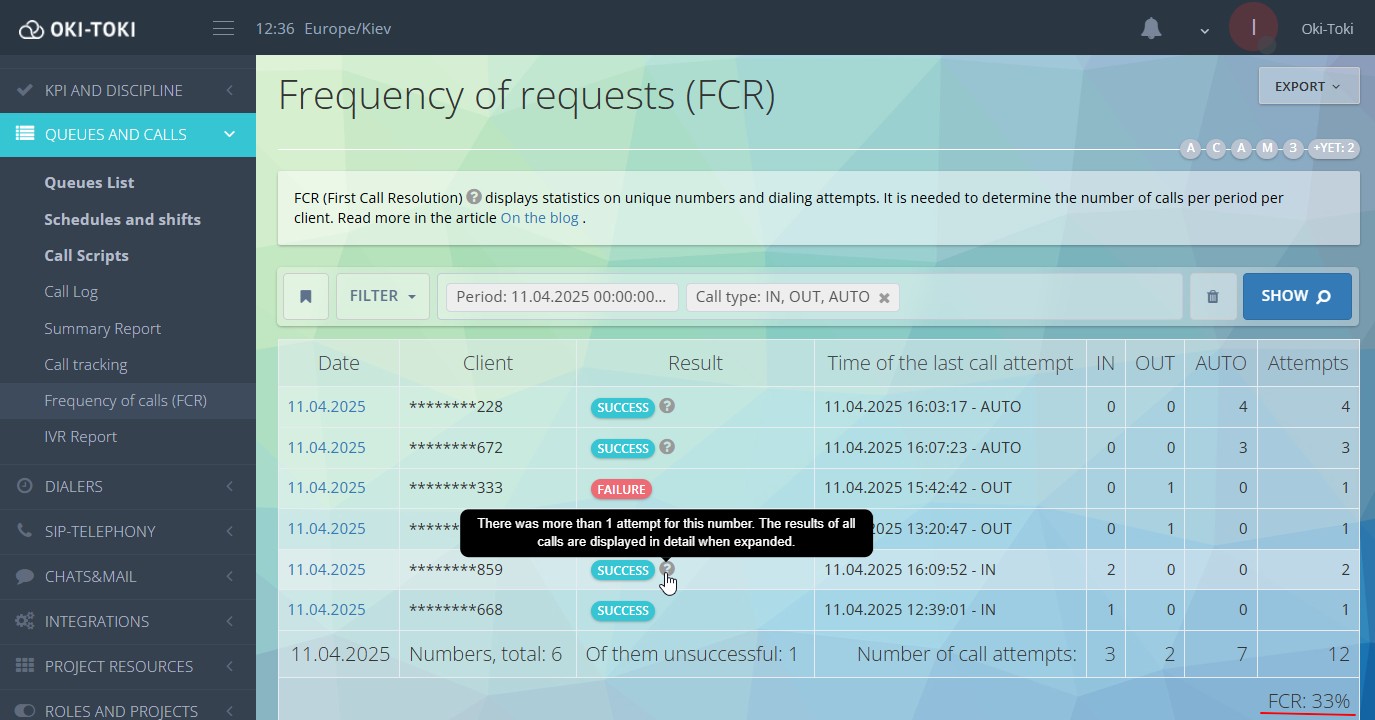
- In Oki-Toki, there’s a history of all interactions with customers, including calls, chats, and other communication channels. Reports make it easy to gather the necessary statistics, listen to conversations, or view dialogue transcripts to analyze the entire communication chain.
Descriptive Analytics
Analyzes past data to understand what has already happened. Useful when you need to understand how the call center worked for a specific period, what were the trends, and where there are weaknesses. In simple terms, descriptive analytics answers the questions «What happened?» and «What are our results?». It does not predict the future or give advice, but simply shows facts and figures.
In Oki-Toki, descriptive analytics is used in various reports, for example:
- Call Log – a detailed report on incoming, outgoing, and dialer calls for the selected period.
- Call tracking – statistics on unique incoming numbers, dialing attempts, and waiting and conversation duration.
- Attempt Log – a record of how many times the dialer tried to reach a client.
- IVR Report – which buttons clients pressed or what words they spoke in the IVR voice menu.
- Summary Reports (on calls and users) – an analysis of agent workload, statuses at the agent’s workstation, call success rate, waiting time, average talk time (AHT), etc.
Using descriptive analytics, you can see how the call center worked over a period, assess the efficiency of agents, and the workload on the call center.
Diagnostic Analytics
Answers the question «why?» and helps figure out the reasons for problems and incidents in the call center’s operation. That is, it analyzes events that have occurred to understand what went wrong and why.
- Why are employees late for shifts? Perhaps schedules are poorly organized (WFM) or there are too long breaks between shifts, disrupting the work rhythm. In Oki-Toki, you can automatically set shifts for agents and create a convenient schedule.
- Why doesn’t the dialer produce the desired results? The report «Dialer Operation» will show how much time the dialer was idle without tasks, how many calls were not accepted by agents, how many were dropped and missed.
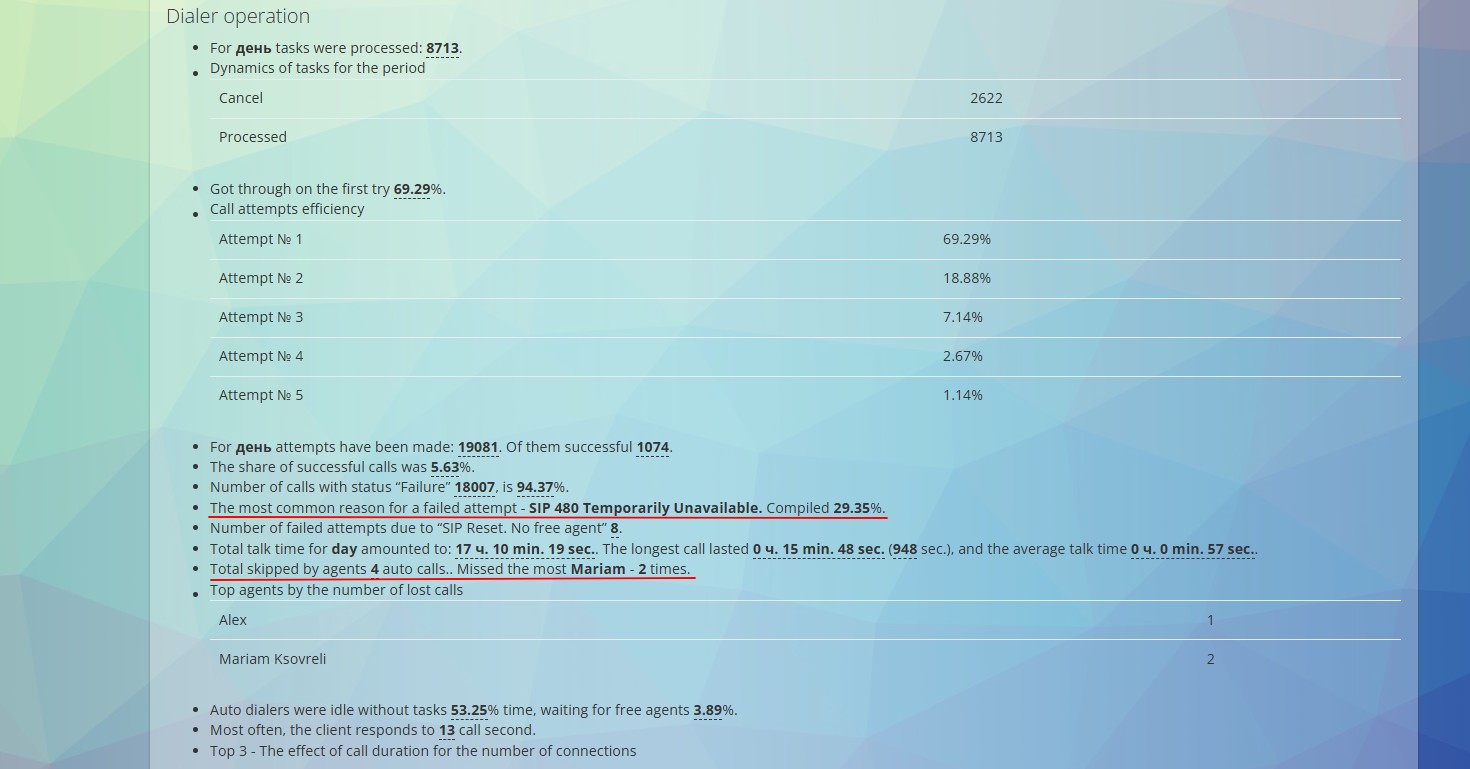
- Why has the number of missed calls increased? The reports show the number of calls missed by agents over a period and what percentage of the total that is. Perhaps, some agents were in the status of «Stepped Away», there were not enough shifts, or increased calls were influenced by advertisements or promotions.
Diagnostic analytics not only displays a problem but also provides an understanding of what caused it. Meaning it can be resolved more quickly and avoided in the future.
Speech Analytics
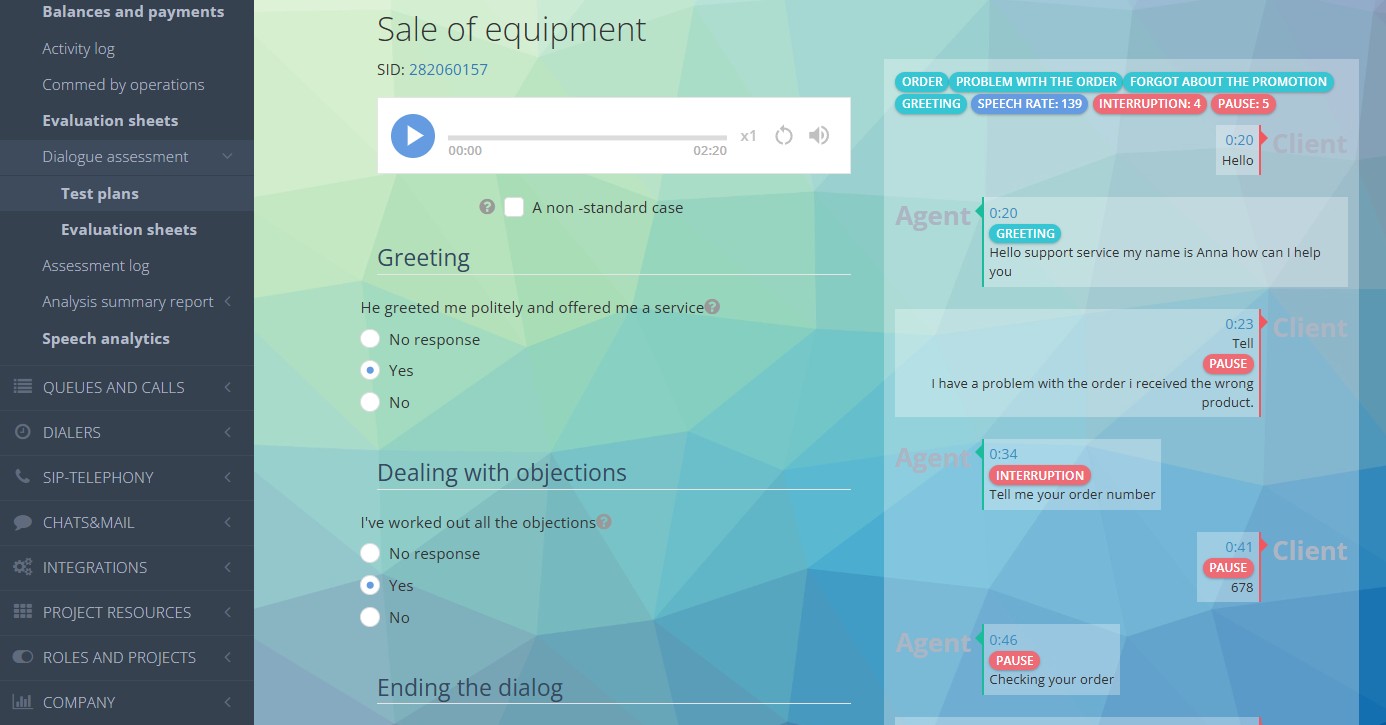
This is the analysis of calls to understand their content, extract useful information, and identify recurring moments. For this, speech recognition technology is used, which helps to identify problems in the conversation. The system will also track key phrases and “problem dialogs”, for example, if a customer is dissatisfied or the agent did not provide the necessary information.
- Speech analytics in Oki-Toki according to set rules will find key metrics in the conversation. These might be essential phrases that had to be uttered but were not, such as «promo», «bonus». Or conversely, the agent said something they shouldn’t have – used «filler words», obscene language, etc.
- The system will also display the agent’s speech tempo, interruptions of the customer, and pauses in the dialogue.
- Using bilingual transcripts will display customer’s words such as «not satisfied», «unclear» or «don’t want», which could indicate possible dissatisfaction or doubts regarding the provided service.
Operational Analytics
Operational analytics helps optimize the operation of the contact center, making processes more efficient. It all comes down to automation or improving work based on gathered information.
-
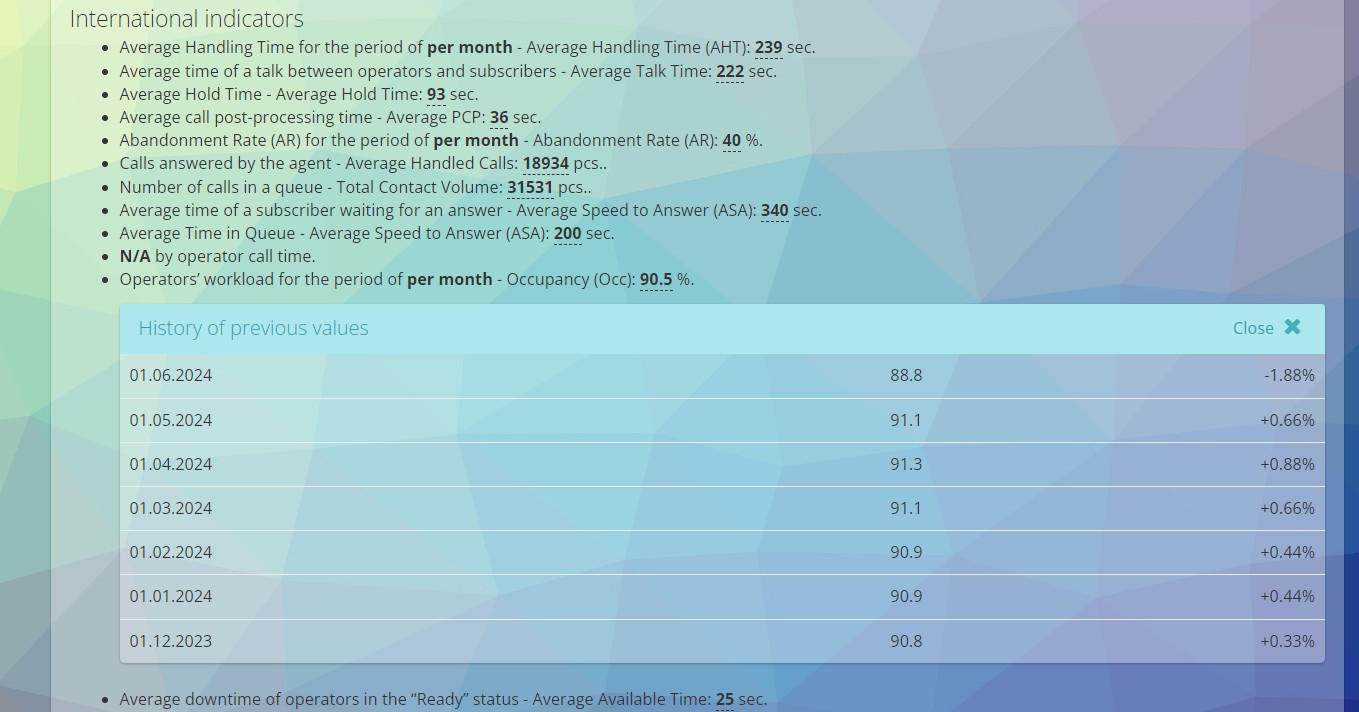
- For example, Oki-Toki helps track how busy the agents are (Occupancy) and direct calls to be evenly distributed among all employees or according to set priorities. Such call routing will help avoid overloading individual agents.
- Or you can organize automated calling for mass notifications or surveys. This will reduce the workload of staff and help quickly reach a large number of clients.
Analytics in a contact center with Oki-Toki
Analytics and reporting — it’s not just about collecting information, but also about choosing the right tools: widgets, charts, reports, briefings — everything is located in a single Oki-Toki interface:
- Widgets: with dashboards, you can visualize many parameters, such as active calls, waiting time for clients, agent statuses, call quality, etc.
- CRM Integration: Oki-Toki integrates with many CRM systems, offering the possibility of working with clients in external applications.
- Summary reports: more than 10 reports for an overall view of the call center’s operation.
- Reporting: more than 25 detailed reports, organized by sections.
- KPI: rules and reports for compliance with standards.
- Reports and DataMixer: automated reports with call center data analytics, featuring the selection of necessary sections and automated emailing.
- Speech analytics: setting rules for keyword detection, with visual display of results in the Call Log.
- WFM: creating work schedules for agents and planning shifts.
Although analytics might seem complicated, it’s extremely important, and Oki-Toki will help you manage them. With us, you can optimize many processes, leading to an increase in the efficiency of your call center. If you have any questions about the functionality of Oki-Toki, submit a request on our website, and we will explain everything in more detail.